
Measuring our effectiveness
The performance dashboard below is illustrative only. We will listen to customers and stakeholders over the coming months to ensure we report the most relevant performance indicators with the desired frequency. Our dashboard will go live on our website post Ofgem’s final determinations on our RIIO-ED2 Business Plan and prior to the start of ED2.
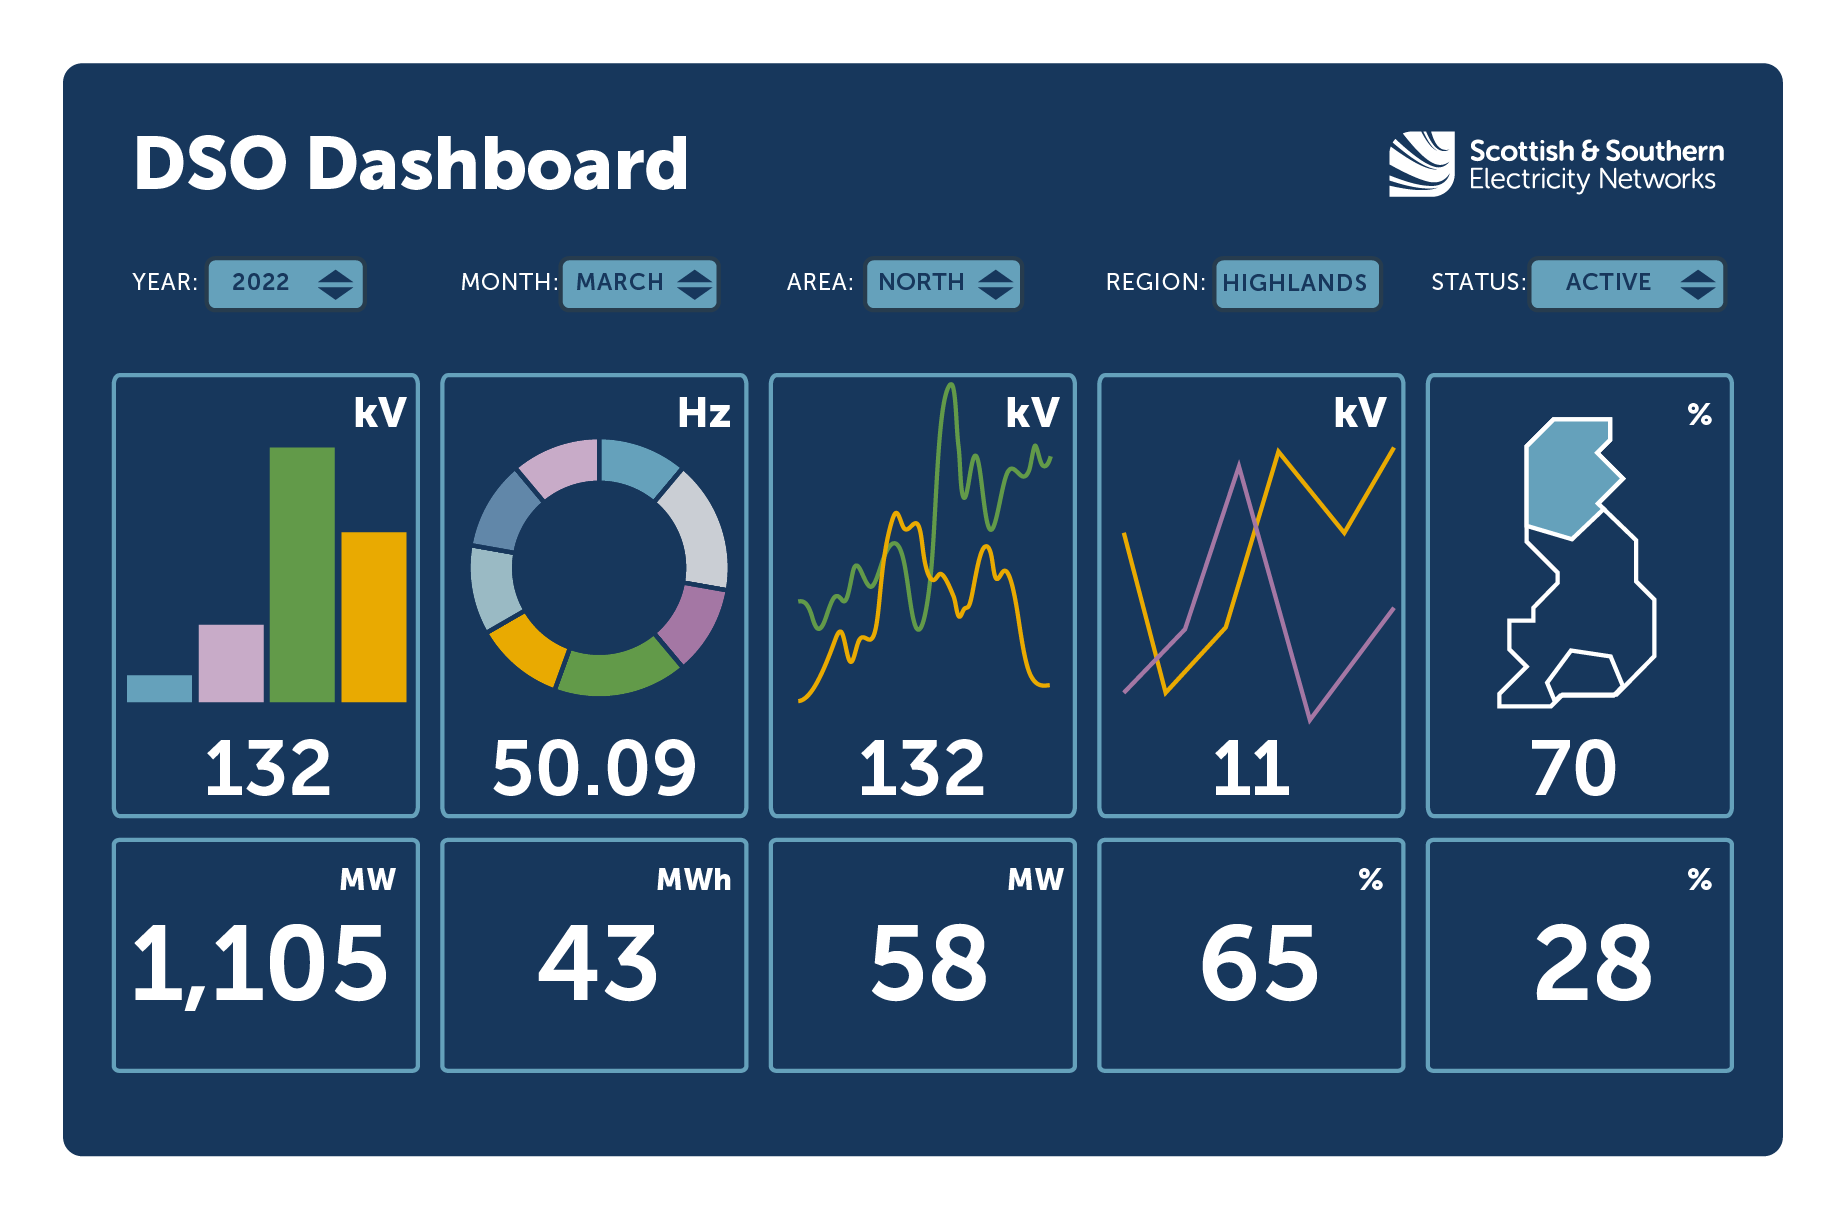
The performance dashboard above is illustrative only
We expect to include:
- Annual volume of flexibility procured (MW):
actual to date vs. ED2 target by product (N.B. Four products = Sustain, restore, secure, dynamic) - Monthly volume of flexibility dispatched (MWh):
last month and cumulative for all prior ED2 months - Annual volume of flexible connections offered (MW):
actual to date vs. ED2 target - Network wide percent of power flows visible to DSO (%):
total annual actual coverage to date vs. ED2 target - Percent of capacity utilised by voltage (%):
total annual utilisation by year by voltage (LV, HV, EHV and 132kV; N.B. 132kV is south only)